


This week, the internet is absolutely awash with takes that one might accurately summarise as, “Why the 2019 election result shows that I have been right all along”. Having been the sort of kid who answered the question, “If everyone else jumped off a cliff, would you join them?” with “Hell, yes!” I figured I’d get involved.
Check out this graph showing the age breakdown of voters on Thursday, courtesy of the Tory pollster Lord Ashcroft:
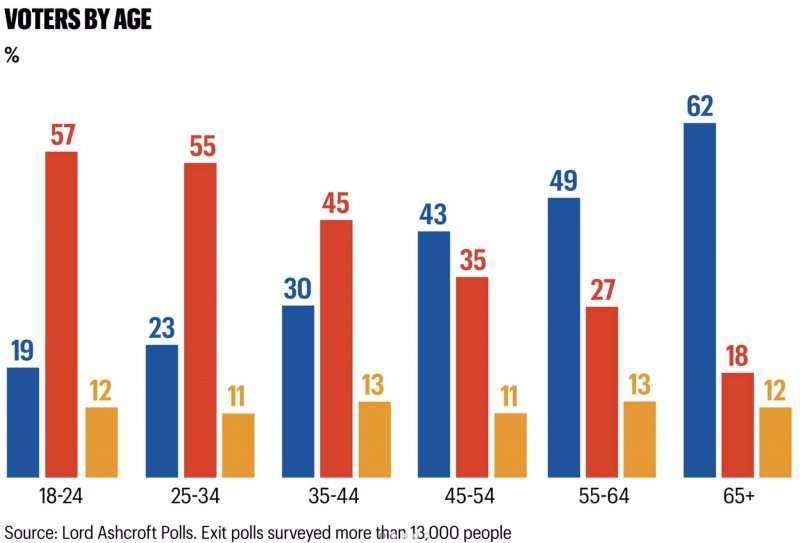
A couple of things strike me about this chart, beyond the obvious correlation between party allegiance and age. One is that propensity to vote Lib Dem is flat across the age range. Another is that people are much more likely to vote Labour than Conservative even into their 40s – which, one might imagine, should be worrying the Tories a bit. A third is that this didn’t stop the party from winning a massive majority last week, which is presumably why it doesn’t actually seem to worry them at all.
But I’m including that graph here mainly as a necessary piece of context before getting to the thing I found really interesting. Here’s another chart from Ian Warren, Boltonian and shed-based data maven for the Centre for Towns (whose co-founder, we should probably disclose at this point, is potential Labour leadership candidate Lisa Nandy). It shows the change in the age profile – from 1981 to 2011 – of 13 of the mostly northern seats that Labour failed to win last week:

In each of them, the share of the population over 65 – and thus overwhelmingly likely to vote Conservative – is up, in several by over 30 points. At the same time, the share of the population aged 18 to 24 – and so overwhelmingly likely to vote Labour – has collapsed, in many by over 20 points.
Over the last few decades, of course, society has aged: people are living longer, so you’d expect the share of the population over 65 to have increased, and for those in other age brackets to have reduced as a consequence. So is this the pattern for all towns?
Well, helpfully the Centre for Towns has a data tool, which enables me to check and confirm that – no, it isn’t. Here are the population stats for two southern towns chosen fairly randomly – Tunbridge Wells on the left, and Brighton & Hove on the right.

Getting comparable figures out of them involves some maths, but by my reckoning… In Tunbridge Wells, both the 18-24 and the 65+ segments have fallen as a share of the overall population. In Brighton & Hove, meanwhile, the 18-24 group is up, and the over 65 segment down. We can speculate on the reasons why – growing student numbers; London’s housing crisis pushing more working-aged people to commute from satellite towns in Kent – but all that matters here is that the change in age profile in those northern seats isn’t universal.
So why are some towns losing young people and gaining old ones? Lifestyle factors will be one reason: basically, living in a city is fashionable now in a way it wasn’t in 1981. (I wrote about this all the way back in 2015.)
But another, I’d guess, is economics. For reasons we’ve often discussed on CityMetric, around the shift to services and the growing importance of agglomeration, a falling share of jobs are in towns, and a growing share are in cities.
The result of this is an internal brain drain: a chunk of the population of each town leaves to go to university at 18 and finds they have no particular reason to move back. For those on the outskirts of London, or other boomtowns, some move back in their 30s to start families. But for places like Workington, they don’t.
The net result is that many of those towns have populations with fewer young people, more old ones – and who are increasingly likely to vote Tory.
This isn’t a full explanation, of course. Those figures cover the period from 1981 to 2011, so chart a long-term trend: they’re not enough to explain the change in Labour’s fates since 2017 and 2019.
Nonetheless, if you want to know why traditionally Labour seats in the north are going Tory, while affluent places like Brighton, Canterbury and Cambridge have gradually shifted from surprise Labour wins to solid Labour seats, this seems to be a very probable reason why.
Or to put it another way: I Was Right All Along.
Anyway, please subscribe to my newsletter.
Jonn Elledge is the editor of CityMetric. He is on Twitter as @jonnelledge and on Facebook as JonnElledgeWrites.
Content from our partners


Related


